
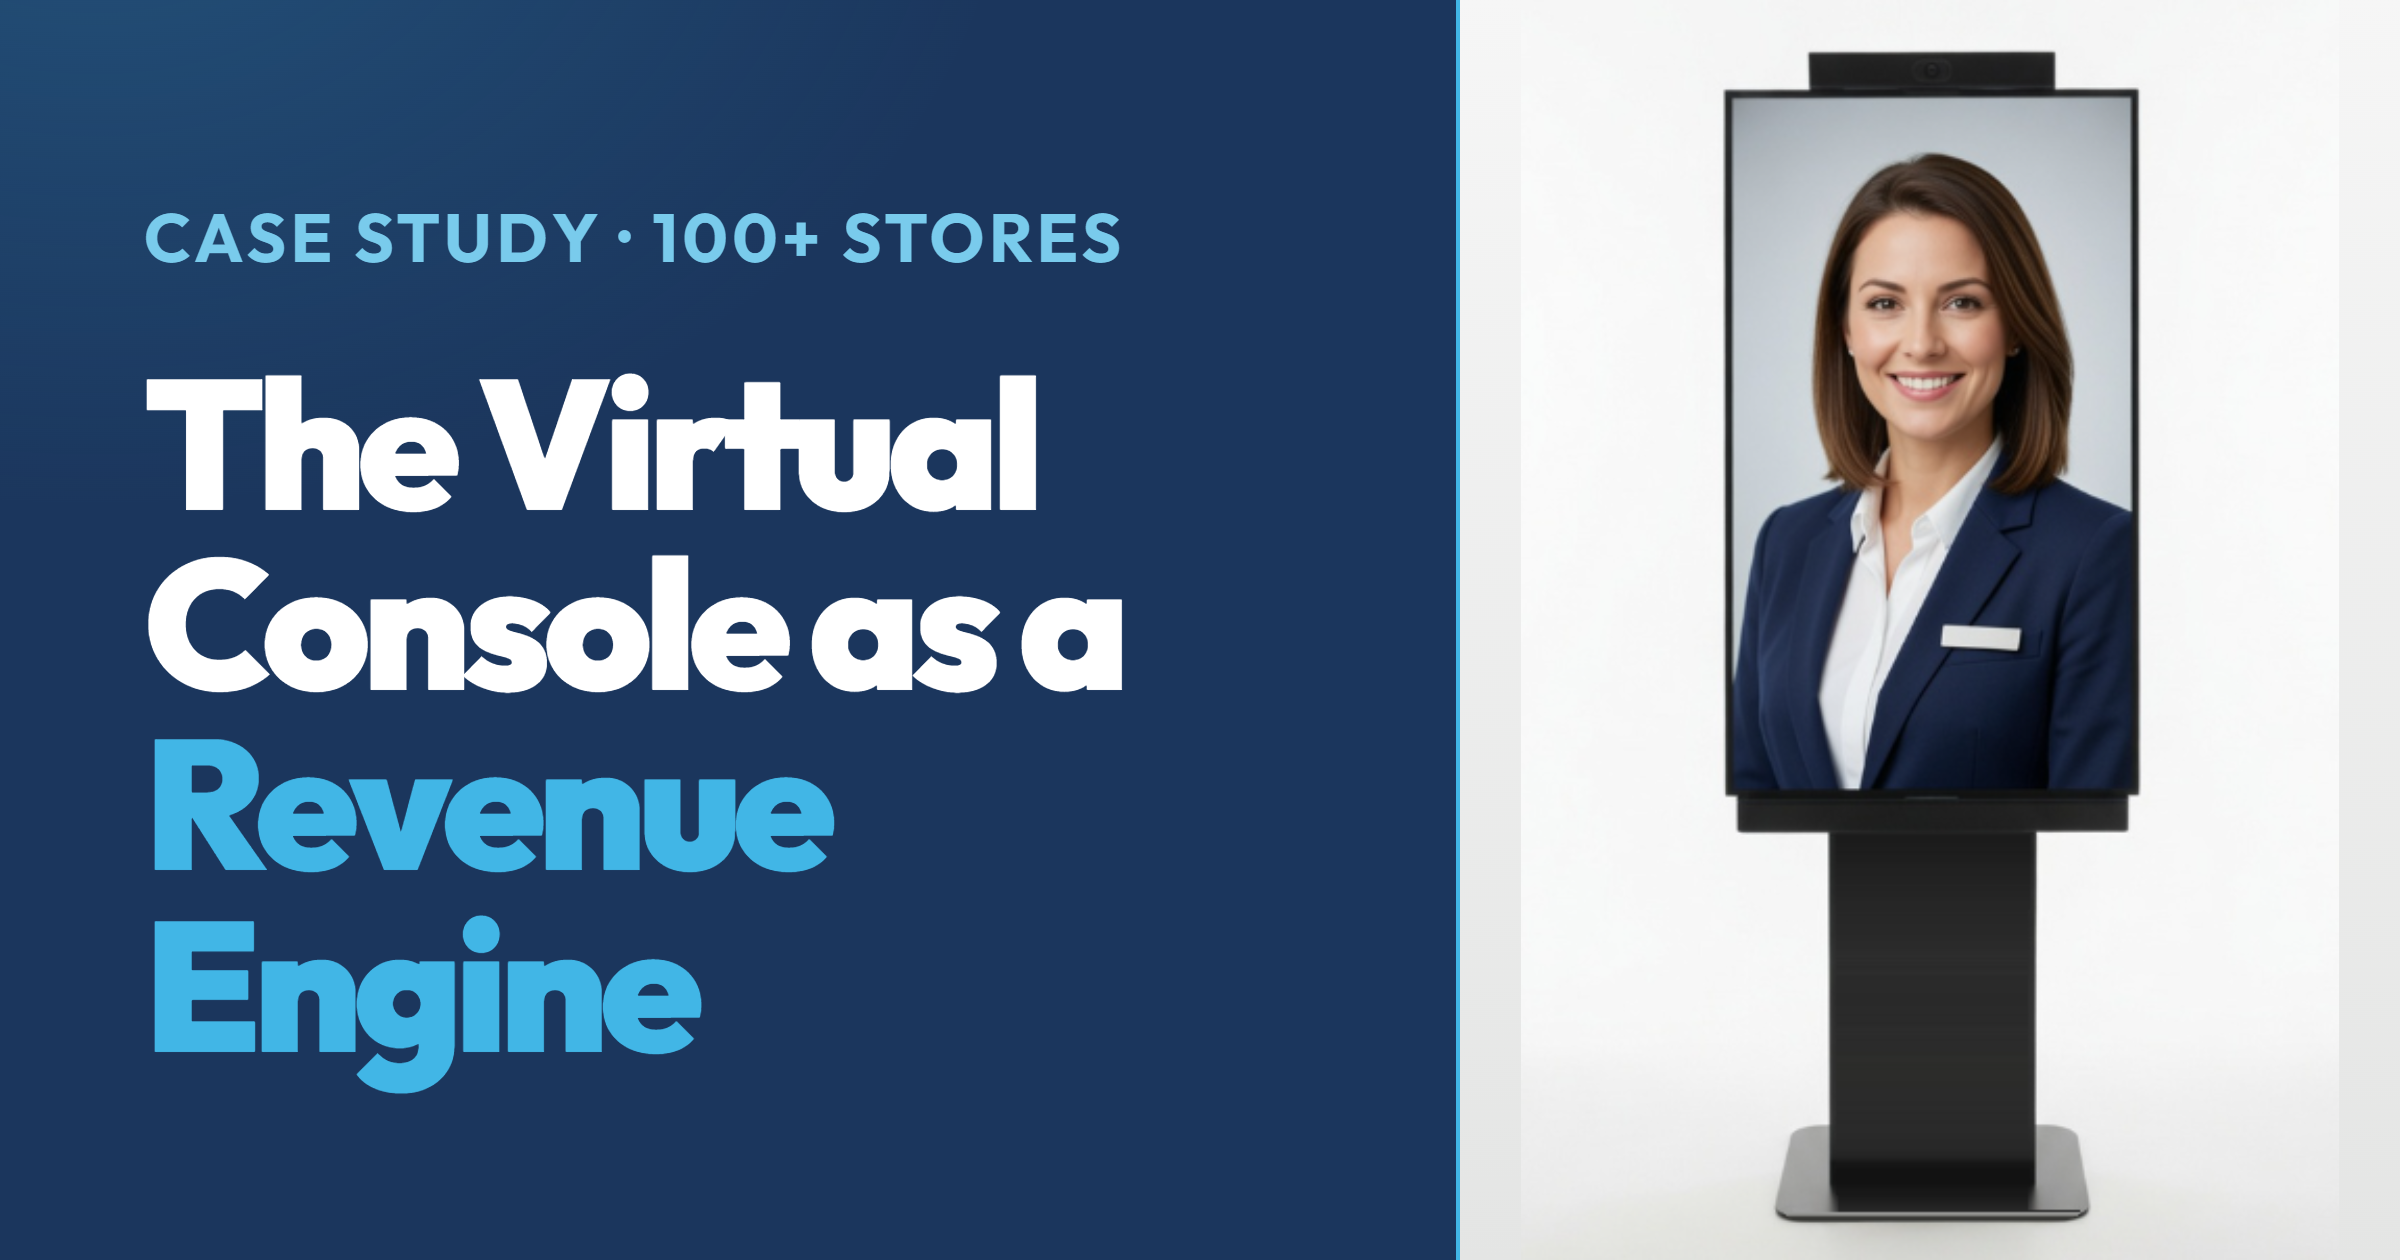
How enhanced office coverage turns unstaffed hours into revenue opportunities.
Move-in data · 9-month off-peak period · 100+ stores
Executive Summary
Self storage has historically been torn between two models. The traditional model staffs an office during business hours and accepts coverage gaps before opening, at lunch, after close, and whenever a manager is pulled away. The remote and unmanned model eliminates the office and staff entirely, and with it every rental and service opportunity that walks up to a closed office is deflected to other channels or, more likely, lost outright. Operators who traditionally staff with coverage gaps or go unmanned are not optimizing on a low volume channel. They are objectively forfeiting revenue and service opportunities.
This study demonstrates a third path. It enhances the traditional model with a hybrid approach: it keeps the office open with expanded hours and no coverage gaps. The traditional model is a faith based approach to coverage. When an on-site manager locks the front door and leaves, or simply neglects the office, regional and VP-level leadership have no way of knowing. The Virtual Console turns assumed coverage into verified coverage. Every store gets consistent, high-quality managers with greater presence driving revenue and customer experience at a fraction of traditional staffing economics.
The evidence has been hiding in plain sight. A property management system records where a lead was generated. It does not record the customer’s journey or where the lease was actually signed. EaseOS transaction-level data reconstructs that journey across 18,750 unique move-ins over nine months, and significant findings emerge that contradict the industry’s assumption that offices can be de-staffed without cost.
The Headline Numbers
- 41% of all new rentals are signed at the Virtual Console. The office remains where a significant amount of rentals happen when it is consistently staffed.
- 60% VC engagement. No matter where the lead is generated, the VC interacts with 60% of new customers, before, at the time of, or immediately after the rental.
- 29.4 additional rentals per store, every year. Captured purely in expanded hours. A full extra month of rentals added to a portfolio that traditional staffing structurally cannot reach.
- 7,635 leases closed at the counter across 100+ stores over nine months.
- 2,311 move-ins during unstaffed hours, captured outside physically staffed hours.
1. The Industry’s Two Models, and the Gap Between Them
Under the traditional model, a staffed office converts walk-in demand, but only during staffed hours. Before opening, over lunch, after close, and during any absence, the counter is dark. Under the remote and unmanned model, there is no office presence at all: walk-in traffic is missed or deflected to a call center or website, and the rental and service opportunities that arrive at the door are structurally forfeited.
Neither model can see what it is losing, because the industry’s system of record cannot measure it. A PMS logs the source of a lead. It does not capture the journey from first touch to signature, nor the channel where the lease was actually signed. Without journey data, operators conclude that offices can be de-staffed or eliminated at little cost. This study uses EaseOS transaction-level data to reconstruct that journey, pairing every move-in with its VC interactions, their timing, and the hour of signing. The reconstructed picture shows the opposite: the office is the highest-leverage point in the customer journey, provided it is always open.
2. Where Leads Are Sourced and Generated
Every move-in is a unique, deduplicated lease mapped to exactly one lead source. The breakdown below shows total move-ins per source, the subset that engaged the VC before renting, and those that ultimately signed their lease at the VC. The headline: regardless of where the lead is generated, the VC engages 60% of new customers (11,170 of 18,750) before, at the time of, or immediately after the rental.
Lead source breakdown:
- Manual entry: 6,789 move-ins — 74% used the VC — 4,223 signed @ VC
- Web: 6,121 move-ins — 43% used the VC — 1,295 signed @ VC
- Third-party marketplace: 3,728 move-ins — 59% used the VC — 1,422 signed @ VC
- Unknown: 1,742 move-ins — 52% used the VC — 568 signed @ VC
- Virtual Console: 368 move-ins — 100% used the VC — 162 signed @ VC
- Other: 2 move-ins — 50% used the VC — 0 signed @ VC
- Total: 18,750 move-ins — 60% used the VC — 41% signed @ VC
VC used % is the share of source move-ins that engaged the VC before or within 30 days of signing a lease. Signed @ VC is move-ins that engaged the VC at the time of signing. The lead-source breakdown attributes 7,670 signed leases across channels; the counter-completion system of record reports 7,635, used throughout as the source of truth. The small difference reflects the timing of when each system records a signed lease and does not affect any figure in this study.
Reading Manually-Entered Leads Correctly
Manual entry is a human lead-creation path. A person keys the lead into the PMS over the phone or in-store via the VC. Its strong funnel (74% usage, 84% sign rate) partly reflects how and when the lead is captured rather than superior channel quality. Deduplication counts each move-in once. It does not reattribute the bucket a manually-keyed lease lands in.
3. How to Attribute the VC’s Role to Lease Signing
Of all 18,750 move-ins portfolio-wide, 7,697 (41.1%) were signed on or after a VC touch, the same-day (6,304) and post-touch (1,393) populations the VC credibly assisted. This is the study’s second headline, and it is worth separating from where a lease is executed: 7,635 leases (the counter system of record) were signed at the VC itself, while 7,697 were signed on or after a VC touch. The two definitions land within 62 leases of each other, and both put roughly 41% of new rentals at the Virtual Console, underscoring the value of an expanded, consistently staffed office with high-quality managers working leads and closing rental opportunities.
Attribution breakdown:
- Signed same day as first VC touch: 6,304 (33.6%) — VC-assisted, tight temporal link
- Signed proximal to VC touch: 1,393 (7.4%) — strongest causal candidate (nurtured)
- Not VC-attributable: 11,053 (58.9%) — no rental credit claimed
- Total move-ins: 18,750 (100%)
Attribution figures are drawn from the transaction-level record. The 11,170 move-ins that engaged the VC within 30 days narrow to the 9,372 VC-touched rentals used for attribution here once long-lag existing-tenant service touches, including 1,735 records whose lease predated the first VC touch by more than a week, are set aside. The difference does not affect the population shares.
4. When These Rentals Happen
Of the 7,635 rentals completed at the Virtual Console on a spread throughout the day, a conservative analysis of coverage gaps yielded 2,311 (30.3%) that occurred during hours when a store was not physically staffed: before opening (before 9 AM), the lunch hour (12 to 1 PM), and after close (after 5 PM). These leases occurred when a conventional staffed office would likely have missed them, and per the attribution logic above, they are the cleanest incremental contribution of the VC. The VC is pulling double duty. Great virtual managers are consistently closing rentals throughout the day at a fraction of the on-site staff cost, while adding incremental rentals in expanded hours where no on-site staff is ever present.
Move-ins by hour — staffed:
- 9A: 456
- 10A: 658
- 11A: 830
- 1P: 896
- 2P: 906
- 3P: 831
- 4P: 794
Move-ins by hour — unstaffed:
- 7A: 15
- 8A: 272
- 12P: 860 (lunch)
- 5P: 619
- 6P: 467
- 7P: 81
- 8P: 5
Unstaffed-hours breakdown:
- Before opening (7–8 AM): 287 move-ins (12%)
- Lunch hour (12 PM): 860 move-ins (37%)
- After close (5–8 PM): 1,164 move-ins (50%)
- Total expanded hours: 2,311 move-ins (100%)
The After-Close Story
The 5 to 8 PM window alone delivers 1,164 move-ins, 50% of all expanded-hours activity and the single largest coverage gap. This is evening demand that would simply have walked away under a traditional staffing model.
5. Incremental Capacity: Rentals Per Store, Per Month
Normalizing expanded-hours volume across the portfolio quantifies what the VC adds beyond the limits of traditional staffing. The calculation: 2,311 expanded-hours move-ins spread across every store in the portfolio over nine months.
Per-store breakdown:
- Before opening (7–8 AM): 287 total — 0.30 per store/mo — 3.7 per store/yr
- Lunch hour (12 PM): 860 total — 0.91 per store/mo — 10.9 per store/yr
- After close (5–8 PM): 1,164 total — 1.23 per store/mo — 14.8 per store/yr
- Total expanded hours: 2,311 total — 2.45 per store/mo — 29.4 per store/yr
6. The Expanded Hours Business Case
Every store in the portfolio captures a conservative 2.45 rentals per store per month it would most likely not have captured if traditionally staffed. These are leases closed with zero on-site labor during hours a conventional office would be closed or empty. Because these move-ins occur outside staffed hours, they represent near-pure incremental revenue at minimal staffing cost, rather than reclassified daytime demand needing full on-site payroll.
What 2.45 incremental rentals adds up to:
- 2.45 incremental rentals per store, per month
- 29.4 rentals added per store, per year
- +1 month of rentals added per store, per year
Across an industry-average length of stay, each incremental rental compounds well beyond its first month of rent. At 29.4 incremental rentals per store per year, the VC adds roughly a full extra month of rental volume to every store, recurring revenue captured with no marginal on-site labor. Applied across the portfolio, that is thousands of additional leases a year that traditional staffing structurally cannot reach.
The Bottom Line
The most notable incremental figure is approximately 3,080 incremental leases per year portfolio-wide, closed during unstaffed hours with no marginal labor cost, where the VC is the sole channel by necessity. The annual figure extrapolates the observed expanded-hours rate of 2.45 rentals per store per month across every store in the portfolio over a full 12 months. It holds the measured rate constant and does not assume growth. Notably, this nine-month window falls largely within the off-peak storage season, when move-in demand is structurally lower. A full year that includes the spring and summer peak would likely push the incremental total above this estimate.
Methodology
All figures are unique, deduplicated move-ins. Each lease maps to a single lead source based on how it was created in the PMS. The PMS records lead origin but not the customer journey or signing channel, which were reconstructed from EaseOS transaction-level data. Attribution follows the convention in Section 3: rental credit is claimed only for leases signed on or after the first VC interaction. VC-touched records whose lease predates the touch are excluded from lease attribution, and those predating it by more than a week are treated as existing-tenant activity. The study does not assign fixed percentage splits between touchpoints, as the data cannot support them. Period: a recent nine-month off-peak season, 100+ stores.
See What This Looks Like at Your Facilities
EaseOS plugs into the management, access control, and payment systems you already run. Most operators see the operating system working in their business in as little as two weeks.